前言
本项目使用数据挖掘相关算法对企业税务是否合规进行预测。本项目主要使用了XGBoost和随机森林两种算法进行对比分析。整个项目包含了一般项目的所有流程:特征预处理,特征编码,特征过滤,数据集切分,模型训练,模型评价,可视化检视。经过实验对比分析,随机森林的预测效果略优于XGBoost,他们的准确率最高都能达到80%以上(随机森林可达86%)。本项目所用的数据集来源于公众号:Dathon数据分析
实验部分
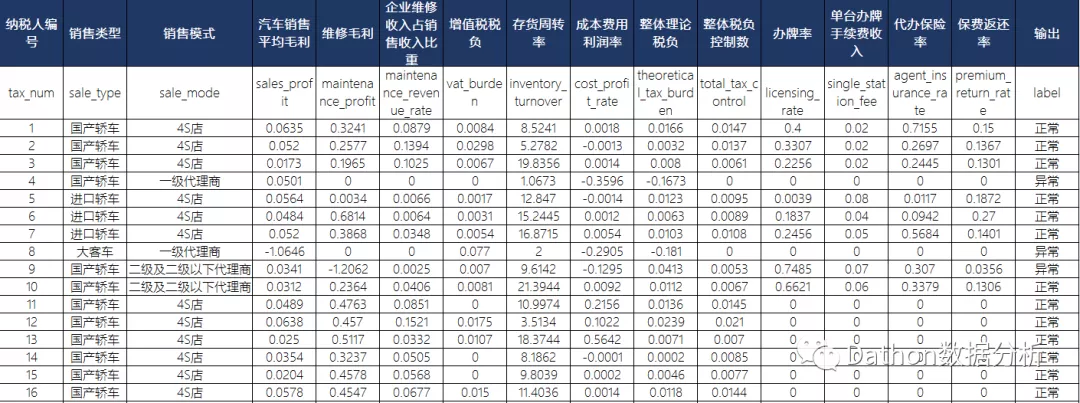
数据集介绍
本实验所用数据集是关于某汽车销售行业124位纳税人的纳税情况。数据集保存为csv格式,最后一列是标签,共有两个类型:异常/正常。前15列是特征,但显然,第一列纳税人编号不能作为有效特征,可以剔除,所以有效特征只有14个。

技术选型
numpy pandas matplotlib sklearn xgboost
数据导入
导包
import numpy as np
import pandas as pd
from matplotlib import pyplot as plt
from sklearn.preprocessing import LabelEncoder
from sklearn.preprocessing import OrdinalEncoder
from sklearn.model_selection import train_test_split as TTS
from sklearn.ensemble import RandomForestClassifier
from sklearn.feature_selection import VarianceThreshold
from sklearn.metrics import f1_score
from sklearn.metrics import average_precision_score
from sklearn.metrics import precision_recall_curve
from sklearn.metrics import plot_precision_recall_curve
from sklearn.metrics import precision_recall_curve
from sklearn.metrics import PrecisionRecallDisplay
from sklearn.model_selection import learning_curve
from sklearn.model_selection import ShuffleSplit
from sklearn.neural_network import MLPClassifier
from xgboost import XGBClassifier as XGBC
df = pd.read_csv('./tax.csv')
df.head()
| tax_num | sale_type | sale_mode | sales_profit | maintenance_profit | maintenance_revenue_rate | vat_burden | inventory_turnover | cost_profit_rate | theoretical_tax_burden | total_tax_control | licensing_rate | single_station_fee | agent_insurance_rate | premium_return_rate | label | |
|---|---|---|---|---|---|---|---|---|---|---|---|---|---|---|---|---|
| 0 | 1 | 国产轿车 | 4S店 | 0.0635 | 0.3241 | 0.0879 | 0.0084 | 8.5241 | 0.0018 | 0.0166 | 0.0147 | 0.4000 | 0.02 | 0.7155 | 0.1500 | 正常 |
| 1 | 2 | 国产轿车 | 4S店 | 0.0520 | 0.2577 | 0.1394 | 0.0298 | 5.2782 | -0.0013 | 0.0032 | 0.0137 | 0.3307 | 0.02 | 0.2697 | 0.1367 | 正常 |
| 2 | 3 | 国产轿车 | 4S店 | 0.0173 | 0.1965 | 0.1025 | 0.0067 | 19.8356 | 0.0014 | 0.0080 | 0.0061 | 0.2256 | 0.02 | 0.2445 | 0.1301 | 正常 |
| 3 | 4 | 国产轿车 | 一级代理商 | 0.0501 | 0.0000 | 0.0000 | 0.0000 | 1.0673 | -0.3596 | -0.1673 | 0.0000 | 0.0000 | 0.00 | 0.0000 | 0.0000 | 异常 |
| 4 | 5 | 进口轿车 | 4S店 | 0.0564 | 0.0034 | 0.0066 | 0.0017 | 12.8470 | -0.0014 | 0.0123 | 0.0095 | 0.0039 | 0.08 | 0.0117 | 0.1872 | 正常 |
df.describe()
| tax_num | sales_profit | maintenance_profit | maintenance_revenue_rate | vat_burden | inventory_turnover | cost_profit_rate | theoretical_tax_burden | total_tax_control | licensing_rate | single_station_fee | agent_insurance_rate | premium_return_rate | |
|---|---|---|---|---|---|---|---|---|---|---|---|---|---|
| count | 124.000000 | 124.000000 | 124.000000 | 124.000000 | 124.000000 | 124.000000 | 124.000000 | 124.000000 | 124.000000 | 124.000000 | 124.000000 | 124.000000 | 124.000000 |
| mean | 62.500000 | 0.023709 | 0.154894 | 0.068717 | 0.008287 | 11.036540 | 0.174839 | 0.010435 | 0.006961 | 0.146077 | 0.016387 | 0.169976 | 0.039165 |
| std | 35.939764 | 0.103790 | 0.414387 | 0.158254 | 0.013389 | 12.984948 | 1.121757 | 0.032753 | 0.008926 | 0.236064 | 0.032510 | 0.336220 | 0.065910 |
| min | 1.000000 | -1.064600 | -3.125500 | 0.000000 | 0.000000 | 0.000000 | -1.000000 | -0.181000 | -0.007000 | 0.000000 | 0.000000 | 0.000000 | -0.014800 |
| 25% | 31.750000 | 0.003150 | 0.000000 | 0.000000 | 0.000475 | 2.459350 | -0.004075 | 0.000725 | 0.000000 | 0.000000 | 0.000000 | 0.000000 | 0.000000 |
| 50% | 62.500000 | 0.025100 | 0.156700 | 0.025950 | 0.004800 | 8.421250 | 0.000500 | 0.009100 | 0.006000 | 0.000000 | 0.000000 | 0.000000 | 0.000000 |
| 75% | 93.250000 | 0.049425 | 0.398925 | 0.079550 | 0.008800 | 15.199725 | 0.009425 | 0.015925 | 0.011425 | 0.272325 | 0.020000 | 0.138500 | 0.081350 |
| max | 124.000000 | 0.177400 | 1.000000 | 1.000000 | 0.077000 | 96.746100 | 9.827200 | 0.159300 | 0.057000 | 0.877500 | 0.200000 | 1.529700 | 0.270000 |
缺失值检查
df.isnull().sum().sum()
数据预处理
数据集中的一些特征和标签都是字符型,例如:国产轿车,4S店,正常。这种字符型值不方便应用到模型中,需要提前编码为数值型。在sklearn中与数据预处理相关的类都在sklearn.preprocessing子包下,读者可参考我之前的文章数据预处理。
字符型标签编码为数值型
data = df.copy()
y =  data.iloc[:, -1]
data.iloc[:, -1] = LabelEncoder().fit_transform(y)
字符型特征编码为数值型
data.iloc[:, 1:3] = OrdinalEncoder().fit_transform(data.iloc[:, 1:3])
X, y = data.iloc[:, 1:-1], data.iloc[:, -1]
data.describe()
| tax_num | sale_type | sale_mode | sales_profit | maintenance_profit | maintenance_revenue_rate | vat_burden | inventory_turnover | cost_profit_rate | theoretical_tax_burden | total_tax_control | licensing_rate | single_station_fee | agent_insurance_rate | premium_return_rate | label | |
|---|---|---|---|---|---|---|---|---|---|---|---|---|---|---|---|---|
| count | 124.000000 | 124.000000 | 124.000000 | 124.000000 | 124.000000 | 124.000000 | 124.000000 | 124.000000 | 124.000000 | 124.000000 | 124.000000 | 124.000000 | 124.000000 | 124.000000 | 124.000000 | 124.000000 |
| mean | 62.500000 | 3.435484 | 0.766129 | 0.023709 | 0.154894 | 0.068717 | 0.008287 | 11.036540 | 0.174839 | 0.010435 | 0.006961 | 0.146077 | 0.016387 | 0.169976 | 0.039165 | 0.572581 |
| std | 35.939764 | 1.905243 | 1.169455 | 0.103790 | 0.414387 | 0.158254 | 0.013389 | 12.984948 | 1.121757 | 0.032753 | 0.008926 | 0.236064 | 0.032510 | 0.336220 | 0.065910 | 0.496711 |
| min | 1.000000 | 0.000000 | 0.000000 | -1.064600 | -3.125500 | 0.000000 | 0.000000 | 0.000000 | -1.000000 | -0.181000 | -0.007000 | 0.000000 | 0.000000 | 0.000000 | -0.014800 | 0.000000 |
| 25% | 31.750000 | 3.000000 | 0.000000 | 0.003150 | 0.000000 | 0.000000 | 0.000475 | 2.459350 | -0.004075 | 0.000725 | 0.000000 | 0.000000 | 0.000000 | 0.000000 | 0.000000 | 0.000000 |
| 50% | 62.500000 | 3.000000 | 0.000000 | 0.025100 | 0.156700 | 0.025950 | 0.004800 | 8.421250 | 0.000500 | 0.009100 | 0.006000 | 0.000000 | 0.000000 | 0.000000 | 0.000000 | 1.000000 |
| 75% | 93.250000 | 4.000000 | 1.000000 | 0.049425 | 0.398925 | 0.079550 | 0.008800 | 15.199725 | 0.009425 | 0.015925 | 0.011425 | 0.272325 | 0.020000 | 0.138500 | 0.081350 | 1.000000 |
| max | 124.000000 | 7.000000 | 4.000000 | 0.177400 | 1.000000 | 1.000000 | 0.077000 | 96.746100 | 9.827200 | 0.159300 | 0.057000 | 0.877500 | 0.200000 | 1.529700 | 0.270000 | 1.000000 |
特征过滤
特征过滤是特征选择的一种方式,特征过滤又分为方差过滤和相关性过滤。在本实验中使用的过滤方法是方差过滤,方差过滤就是通过特征本身的方差来筛选特征。比如一个特征本身的方差很小,就表示样本在这个特征上基本没有差异,可能特征中的大多数值都一样,甚至整个特征的取值都相同,那这个特征对于样本区分没有什么作用。所以无论接下来的特征工程要做什么,都要优先消除方差为0的特征。VarianceThreshold有重要参数threshold,表示方差的阈值,表示舍弃所有方差小于threshold的特征,不填默认为0,即删除所有的记录都相同的特征。
X = VarianceThreshold(np.median(X.var().values)).fit_transform(X)
训练集切分
将数据集切分为测试集和训练集
Xtrain, Xtest, Ytrain, Ytest = TTS(X, y, test_size=0.3, random_state=22)
模型训练
XGBoost
xgb = XGBC(n_estimators=20, random_state=420).fit(Xtrain, Ytrain)
xgb_y_pre = xgb.predict(Xtest)
随机森林
rfc = RandomForestClassifier(n_estimators=20, random_state=22)
rfc.fit(Xtrain, Ytrain)
rfc_y_pre = rfc.predict(Xtest)
模型评价
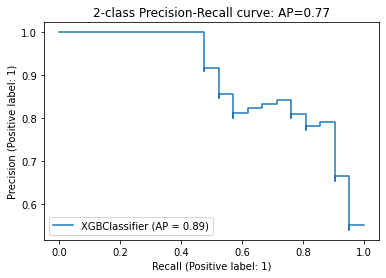
emmm…回归模型的评价指标也就那些,ROC,AUC,P-R图,f1_score等等。本实验中选用了f1_score和P-R图这两个评价指标。
XGBoost
f1_score
f1_score(Ytest,xgb_y_pre)
# 0.8444444444444444
P-R图
average_precision = average_precision_score(Ytest, xgb_y_pre)
disp = plot_precision_recall_curve(xgb, Xtest, Ytest)
disp.ax_.set_title('2-class Precision-Recall curve: '
                   'AP={0:0.2f}'.format(average_precision))

随机森林
f1_score
f1_score(Ytest,rfc_y_pre)
# 0.8636363636363636
P-R图
average_precision = average_precision_score(Ytest, rfc_y_pre)
disp = plot_precision_recall_curve(rfc, Xtest, Ytest)
disp.ax_.set_title('2-class Precision-Recall curve: '
                   'AP={0:0.2f}'.format(average_precision))

可视化展现
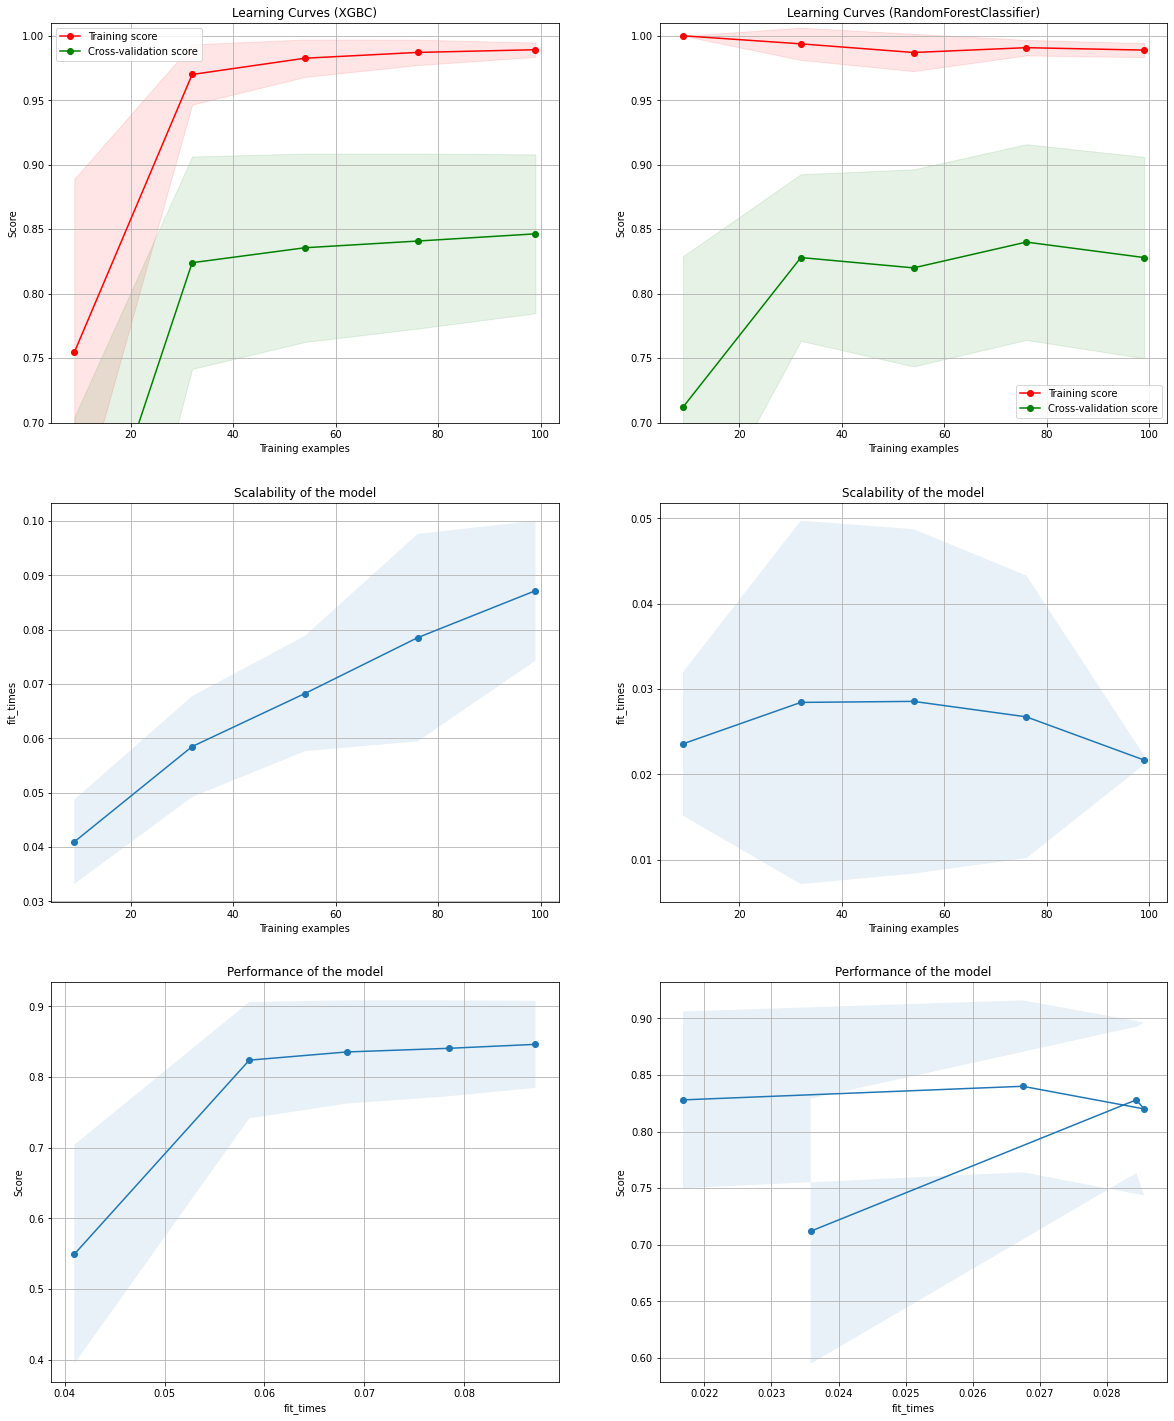
这个还比较有意思点,是借鉴了sklearn官方提供的一个learn curve示例,地址在第二个参考资料。
def plot_learning_curve(estimator, title, X, y, axes=None, ylim=None, cv=None,
                        n_jobs=None, train_sizes=np.linspace(.1, 1.0, 5)):
    if axes is None:
        _, axes = plt.subplots(1, 3, figsize=(20, 5))

    axes[0].set_title(title)
    if ylim is not None:
        axes[0].set_ylim(*ylim)
    axes[0].set_xlabel("Training examples")
    axes[0].set_ylabel("Score")

    train_sizes, train_scores, test_scores, fit_times, _ = \
        learning_curve(estimator, X, y, cv=cv, n_jobs=n_jobs,
                       train_sizes=train_sizes,
                       return_times=True)
    train_scores_mean = np.mean(train_scores, axis=1)
    train_scores_std = np.std(train_scores, axis=1)
    test_scores_mean = np.mean(test_scores, axis=1)
    test_scores_std = np.std(test_scores, axis=1)
    fit_times_mean = np.mean(fit_times, axis=1)
    fit_times_std = np.std(fit_times, axis=1)

    # Plot learning curve
    axes[0].grid()
    axes[0].fill_between(train_sizes, train_scores_mean - train_scores_std,
                         train_scores_mean + train_scores_std, alpha=0.1,
                         color="r")
    axes[0].fill_between(train_sizes, test_scores_mean - test_scores_std,
                         test_scores_mean + test_scores_std, alpha=0.1,
                         color="g")
    axes[0].plot(train_sizes, train_scores_mean, 'o-', color="r",
                 label="Training score")
    axes[0].plot(train_sizes, test_scores_mean, 'o-', color="g",
                 label="Cross-validation score")
    axes[0].legend(loc="best")

    # Plot n_samples vs fit_times
    axes[1].grid()
    axes[1].plot(train_sizes, fit_times_mean, 'o-')
    axes[1].fill_between(train_sizes, fit_times_mean - fit_times_std,
                         fit_times_mean + fit_times_std, alpha=0.1)
    axes[1].set_xlabel("Training examples")
    axes[1].set_ylabel("fit_times")
    axes[1].set_title("Scalability of the model")

    # Plot fit_time vs score
    axes[2].grid()
    axes[2].plot(fit_times_mean, test_scores_mean, 'o-')
    axes[2].fill_between(fit_times_mean, test_scores_mean - test_scores_std,
                         test_scores_mean + test_scores_std, alpha=0.1)
    axes[2].set_xlabel("fit_times")
    axes[2].set_ylabel("Score")
    axes[2].set_title("Performance of the model")

    return plt


fig, axes = plt.subplots(3, 2, figsize=(20, 25))

X, y = data.iloc[:, 1:-1], data.iloc[:, -1]

title = "Learning Curves (XGBC)"
# Cross validation with 100 iterations to get smoother mean test and train
# score curves, each time with 20% data randomly selected as a validation set.
cv = ShuffleSplit(n_splits=100, test_size=0.2, random_state=0)

estimator = XGBC(n_estimators=20, random_state=22)
plot_learning_curve(estimator, title, X, y, axes=axes[:, 0], ylim=(0.7, 1.01),
                    cv=cv, n_jobs=4)

title = r"Learning Curves (RandomForestClassifier)"
# SVC is more expensive so we do a lower number of CV iterations:
cv = ShuffleSplit(n_splits=10, test_size=0.2, random_state=22)
estimator = RandomForestClassifier(n_estimators=20, random_state=22)
plot_learning_curve(estimator, title, X, y, axes=axes[:, 1], ylim=(0.7, 1.01),
                    cv=cv, n_jobs=4)

plt.show()

总结
其实这个项目(也不能叫项目,应该说实验吧)挺简单的,没有什么特别的新意。更多的可能是将整个的项目流程都串起来了。从数据预处理到模型评价和可视化检视,涉及的方法和策略本实验都有所涉及,对初学者应该有指导性帮助。
最后,有需要数据集和完整源代码的可以联系笔者。
