标记-清除
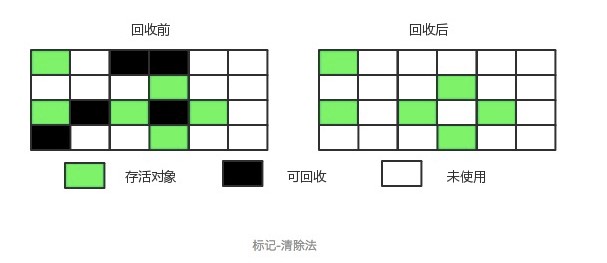
将存活的对象进行标记,然后清理掉未被标记的对象。
不足:
- 标记和清除过程效率都不高;
- 会产生大量不连续的内存碎片,导致无法给大对象分配内存。
标记-整理

让所有存活的对象都向一端移动,然后直接清理掉端边界以外的内存。
复制
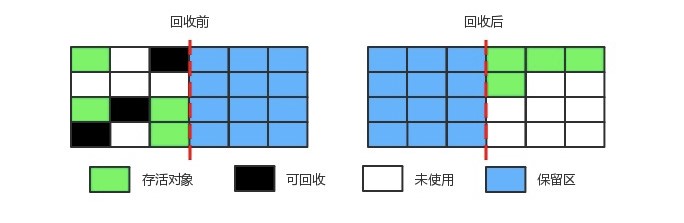
将内存划分为大小相等的两块,每次只使用其中一块,当这一块内存用完了就将还存活的对象复制到另一块上面,然后再把使用过的内存空间进行一次清理。
主要不足是只使用了内存的一半。
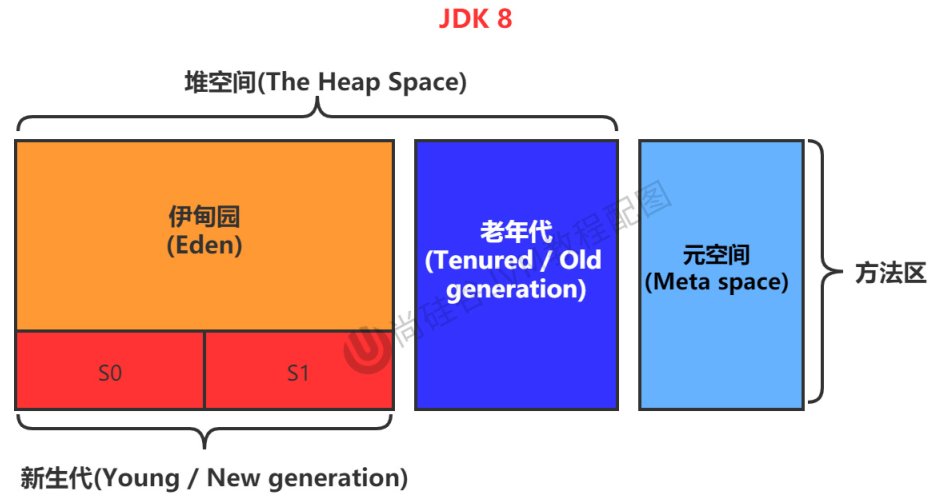
分代收集策略
JDK1.8采用分代收集策略
$ java -XX:+PrintCommandLineFlags -version...UseParallelGC = Parallel Scavenge + Parallel Old分代收集是根据对象的存活时间把内存分为新生代和老年代,根据个代对象的存活特点,每个代采用不同的垃圾回收算法。新生代采用标记—复制算法,老年代采用标记—整理算法。
import java.util.UUID;/** * @author 小怪兽 * @version 1.0 * @since 2022-11-15 */public class Jmap { private byte[] buffer = new byte[500*1024]; private String h = UUID.randomUUID().toString(); public static void main(String[] args) throws Exception { int n = 100000; for (int i = 0; i < n; i++) { Jmap jmap = new Jmap(); Thread.sleep(10); } }}可以使用如下脚本监控jvm的内存使用情况
pid=`jps | grep Jmap | awk '{print $1}'`echo PID: $pidwatch -n 2 -d "jmap -heap $pid"Every 2.0s: jmap -heap 25834 Tue Nov 15 23:31:43 2022Attaching to process ID 25834, please wait...Debugger attached successfully.Server compiler detected.JVM version is 25.202-b08using thread-local object allocation.Parallel GC with 13 thread(s)Heap Configuration: MinHeapFreeRatio = 0 MaxHeapFreeRatio = 100 MaxHeapSize = 16846422016 (16066.0MB) NewSize = 351272960 (335.0MB) MaxNewSize = 5615124480 (5355.0MB) OldSize = 703594496 (671.0MB) NewRatio = 2 SurvivorRatio = 8 MetaspaceSize = 21807104 (20.796875MB) CompressedClassSpaceSize = 1073741824 (1024.0MB) MaxMetaspaceSize = 17592186044415 MB G1HeapRegionSize = 0 (0.0MB)Heap Usage:PS Young GenerationEden Space: capacity = 264241152 (252.0MB) used = 95229184 (90.817626953125MB) free = 169011968 (161.182373046875MB) 36.038740854414684% usedFrom Space: capacity = 43515904 (41.5MB) used = 0 (0.0MB) free = 43515904 (41.5MB) 0.0% usedTo Space: capacity = 43515904 (41.5MB) used = 0 (0.0MB) free = 43515904 (41.5MB) 0.0% usedPS Old Generation capacity = 703594496 (671.0MB) used = 0 (0.0MB) free = 703594496 (671.0MB) 0.0% used1070 interned Strings occupying 78624 bytes.Heap Usage:PS Young GenerationEden Space: capacity = 264241152 (252.0MB) used = 206210320 (196.65748596191406MB) free = 58030832 (55.34251403808594MB) 78.03868490552145% usedFrom Space: capacity = 43515904 (41.5MB) used = 0 (0.0MB) free = 43515904 (41.5MB) 0.0% usedTo Space: capacity = 43515904 (41.5MB) used = 0 (0.0MB) free = 43515904 (41.5MB) 0.0% usedPS Old Generation capacity = 703594496 (671.0MB) used = 0 (0.0MB) free = 703594496 (671.0MB) 0.0% used1070 interned Strings occupying 78624 bytes.Heap Usage:PS Young GenerationEden Space: capacity = 264241152 (252.0MB) used = 264241152 (252.0MB) free = 0 (0.0MB) 100.0% used From Space: capacity = 43515904 (41.5MB) used = 0 (0.0MB) free = 43515904 (41.5MB) 0.0% usedTo Space: capacity = 43515904 (41.5MB) used = 0 (0.0MB) free = 43515904 (41.5MB) 0.0% usedPS Old Generation capacity = 703594496 (671.0MB) used = 0 (0.0MB) free = 703594496 (671.0MB) 0.0% used1073 interned Strings occupying 78792 bytes.Heap Usage:PS Young GenerationEden Space: capacity = 264241152 (252.0MB) used = 10466912 (9.982025146484375MB) free = 253774240 (242.01797485351562MB) 3.961121089874752% usedFrom Space: capacity = 43515904 (41.5MB) used = 524320 (0.500030517578125MB) free = 42991584 (40.999969482421875MB) 1.204892813441265% usedTo Space: capacity = 43515904 (41.5MB) used = 0 (0.0MB) free = 43515904 (41.5MB) 0.0% usedPS Old Generation capacity = 703594496 (671.0MB) used = 8192 (0.0078125MB) free = 703586304 (670.9921875MB) 0.0011643070044709389% used1058 interned Strings occupying 77752 bytes.Heap Usage:PS Young GenerationEden Space: capacity = 264241152 (252.0MB) used = 15956744 (15.217536926269531MB) free = 248284408 (236.78246307373047MB) 6.038705129472036% used From Space: capacity = 43515904 (41.5MB) used = 425984 (0.40625MB) free = 43089920 (41.09375MB) 0.9789156626506024% usedTo Space: capacity = 43515904 (41.5MB) used = 0 (0.0MB) free = 43515904 (41.5MB) 0.0% usedPS Old Generation capacity = 703594496 (671.0MB) used = 8192 (0.0078125MB) free = 703586304 (670.9921875MB) 0.0011643070044709389% used1058 interned Strings occupying 77752 bytes.Heap Usage:PS Young GenerationEden Space: capacity = 257949696 (246.0MB) used = 20690464 (19.731964111328125MB) free = 237259232 (226.26803588867188MB) 8.021123622491107% usedFrom Space: capacity = 524288 (0.5MB) used = 442384 (0.4218902587890625MB) free = 81904 (0.0781097412109375MB) 84.3780517578125% usedTo Space: capacity = 1048576 (1.0MB) used = 0 (0.0MB) free = 1048576 (1.0MB) 0.0% usedPS Old Generation capacity = 703594496 (671.0MB) used = 16384 (0.015625MB) free = 703578112 (670.984375MB) 0.0023286140089418777% used1058 interned Strings occupying 77752 bytes.Heap Usage:PS Young GenerationEden Space: capacity = 257949696 (246.0MB) used = 58366424 (55.662559509277344MB) free = 199583272 (190.33744049072266MB) 22.62705671108835% usedFrom Space: capacity = 43515904 (41.5MB) used = 442384 (0.4218902587890625MB) free = 43073520 (41.07810974121094MB) 1.0166030332266567% usedTo Space: capacity = 524288 (0.5MB) used = 0 (0.0MB) free = 524288 (0.5MB) 0.0% usedPS Old Generation capacity = 703594496 (671.0MB) used = 24576 (0.0234375MB) free = 703569920 (670.9765625MB) 0.003492921013412817% used 可以看出,创建新对象是总是在Eden区操作,随着不断new对象,Eden区内存使用不断上升,当Eden区空间使用达100%时会执行复制算法将对象复制到From区, 虽然From区的容量远小于Eden区但仍然使Eden的内存使用降到了0%,这是因为当Eden区满了之后会触发YoungGC(Minor GC)清理掉垃圾对象。
当再次触发YoungGC(Minor GC)并且From区满了之后会将存活对象复制到To区,就这样循环往复一定次数(默认15次)之后,存活的数据会复制到老年代(Old Generation)
当老年代的内存不足时会触发Old GC(Major GC)
从概念上讲Old GC(Major GC)指的是针对老年代的GC,Full GC指的是对整个堆空间的GC,不过也有说法是Major GC其实等价于Full GC,因为Major GC其实就是老年代空间不足,新生代的对象没法转移到老年代所以需要先对老年代GC,然后再对新生代GC,可以说Major GC的目的就是为了Minor GC,这其实就是Full GC了。
这里老年代空间不足指的探讨,不足指的是老年代空间使用100%还是超过了一定阈值?这个笔者尚没有看到相关定论,后续可以再深究。